The Census Bureau recently released its annual update on poverty in the United States.
But before drawing conclusions from a poverty rate, it helps to ask a basic question: How is poverty being measured?
The federal government uses two main measures, and they can tell somewhat different stories.
The Official Poverty Measure, or OPM, compares a family’s cash income before taxes with a national poverty threshold based mainly on family size and composition.
Wages, Social Security and pensions count. SNAP benefits, housing assistance and many tax credits generally do not. The measure also does not subtract taxes, childcare, work expenses or out-of-pocket medical costs.
Another major limitation is geography.
The official poverty threshold is basically the same across the country. It does not adjust for differences in local cost of living.
That matters. Wages tend to be lower in places where housing and other costs are also lower. Those areas can appear poorer based on income alone, even though a dollar may buy more there.
The reverse can happen in expensive areas. A household may earn enough to stay above the official poverty line while paying much more for housing and other necessities.
The Supplemental Poverty Measure, or SPM, takes a broader approach.
It counts resources such as SNAP, housing assistance and certain tax credits. It subtracts taxes, childcare, work expenses and out-of-pocket medical costs. Its thresholds also reflect geographic differences in housing costs and whether a household rents, owns with a mortgage or owns without one.
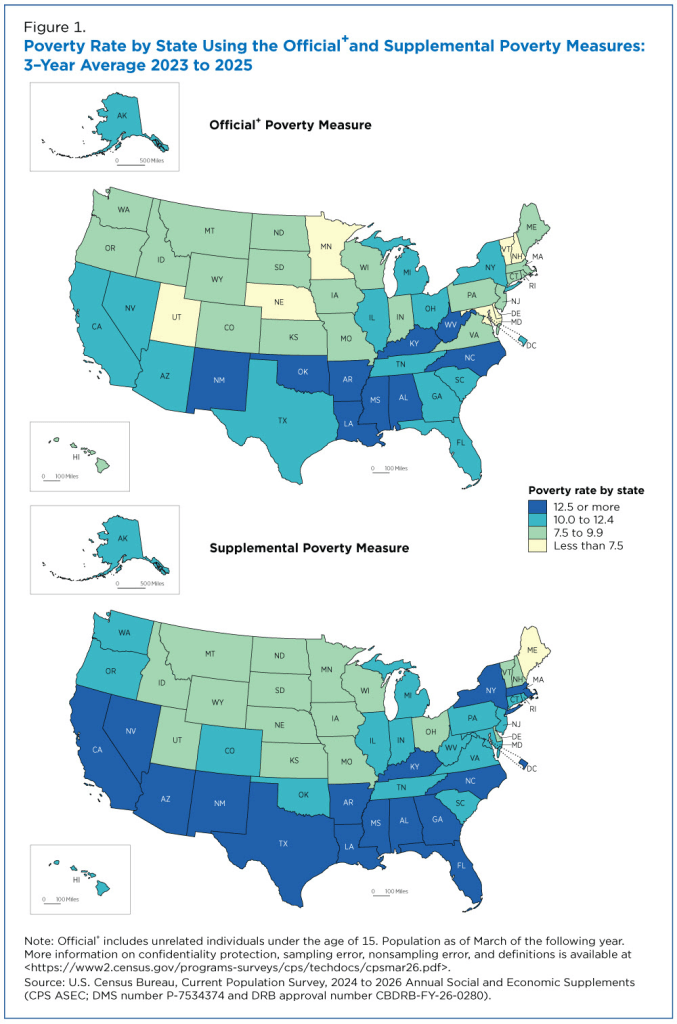
The SPM is not a complete cost-of-living measure, but it recognizes geographic differences much more than the official measure.
Official poverty estimates are readily available through the American Community Survey for counties, cities and even smaller areas. Standard SPM estimates are mainly national and state-level statistics. Census researchers have developed experimental estimates for smaller areas, but there is no routinely published SPM rate for every city and county.
So when we hear that a particular community has a poverty rate of 15% or 20%, we are usually hearing the official measure — the same measure that does not adjust its poverty threshold for local living costs.
The latest state numbers show why the distinction matters.
Using 2023-2025 averages, the national official poverty rate was 10.7%, compared with 13.0% under the SPM.
Nearby states provide an interesting comparison.
Tennessee’s official and supplemental rates were similar and remained closer to the national median.
Virginia’s supplemental rate was significantly higher than its official rate. Georgia showed the same pattern. These states appeared to have lower poverty than reality suggests.
Kentucky and North Carolina also showed no significant change between the two measures. Both have poverty rates significantly above the national rate. In other words, “unchanged” does not mean poverty was low. It means changing the measurement did not significantly alter the result.
West Virginia is less impoverished than it first seems. Its official poverty rate was significantly above the national rate, but its SPM rate was significantly lower than its official rate. Low incomes make it look especially poor when compared with one national cash-income standard. But it also has low housing costs and high homeownership. The SPM recognizes those factors and counts benefits such as SNAP and housing assistance.
California shows the other extreme. Its SPM rate reached 17.8%, among the highest in the country, even though its official rate was not significantly above the national official rate. High housing costs are an important part of that difference.
There is another limitation both measures share:
Poverty is not the same thing as wealth.
A retiree living mainly on Social Security may have modest current income while owning a mortgage-free home, savings and investments accumulated over a lifetime. Those assets generally are not part of the poverty calculation.
College students present another example. A full-time student living off campus may earn very little and be counted as poor even though that low income may be temporary or supplemented by family support or savings. Students living in college dormitories are generally excluded from local Census poverty calculations.
The reverse can also be true. A household may have higher income but little savings, large debts, expensive housing and major childcare costs.
Income, wealth and economic hardship are related. They are not the same thing.
So when someone says, “The poverty rate is 15%,” consider the source and the definition behind the number. Ask: Which measure is being used? Does it account for local costs? What resources and expenses are included? What does it leave out? And is a better measure even available for that community?
Poverty statistics are valuable. But they tell us much more when we understand exactly what they measure — and what they do not.
Here’s the catch: the Supplemental Poverty Measure, which better accounts for geographic housing costs and household resources and expenses, is not routinely available at the local level.
That means cities like Kingsport are still compared with places like New York or San Francisco using the same basic national poverty threshold — a standard whose roots go back to the 1960s. Anyone who has compared housing costs in those places knows that the same income does not buy the same standard of living.
Perhaps one day Census will bring a more complete poverty measure down to the city and county level. That would give communities a better apples-to-apples comparison of economic hardship. Until then, lower-cost communities can sometimes look poorer on paper than their actual purchasing power would suggest.
That does not make poverty statistics meaningless. It means we should use them carefully and understand their limitations.
And none of this is intended to minimize the very real effects of poverty or the responsibility we have to help neighbors who are struggling. Better measurement should help us understand need more clearly — not diminish it.
 Kingsport Spirit
Leave a comment