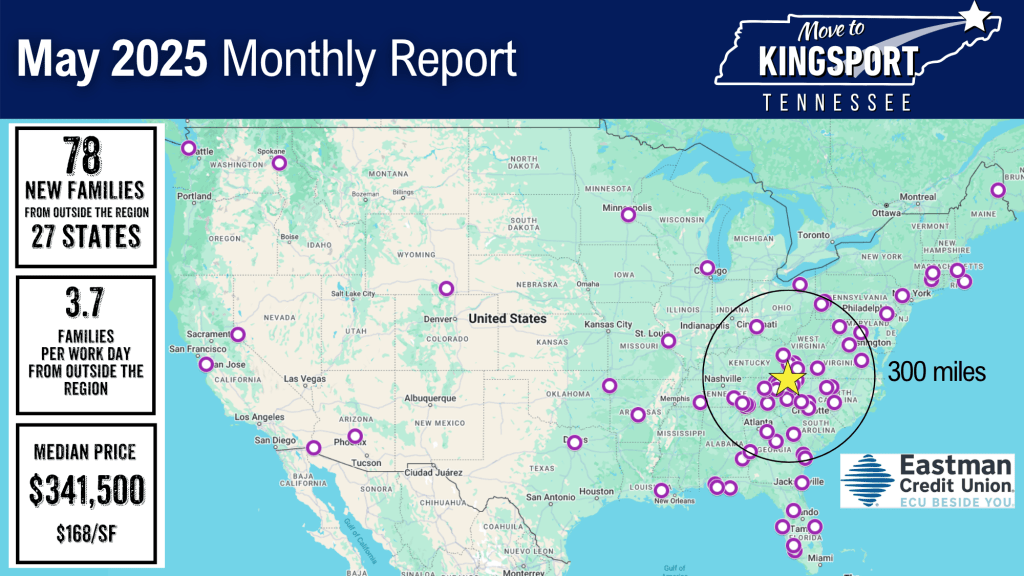
Over the past year, Kingsport has attracted 637 new families from 45 different states, averaging roughly 2.6 out‐of‐region arrivals per workday. In contrast, May 2025 alone saw 78 families move here from 27 states—an equivalent of about 3.7 families per workday. Of those 78, just 33 were home purchases (accounting for nearly $18 million in sales), while the remaining 45 settled into single‐family rentals. Importantly, this dataset relies on newly activated water meters, so mass‐metered multi‐family complexes and group‐quarter facilities (such as assisted living) do not register. This higher daily pace in May suggests that spring 2025 represented a particularly active period for relocation, likely driven by seasonal factors such as job transfers or school schedules.
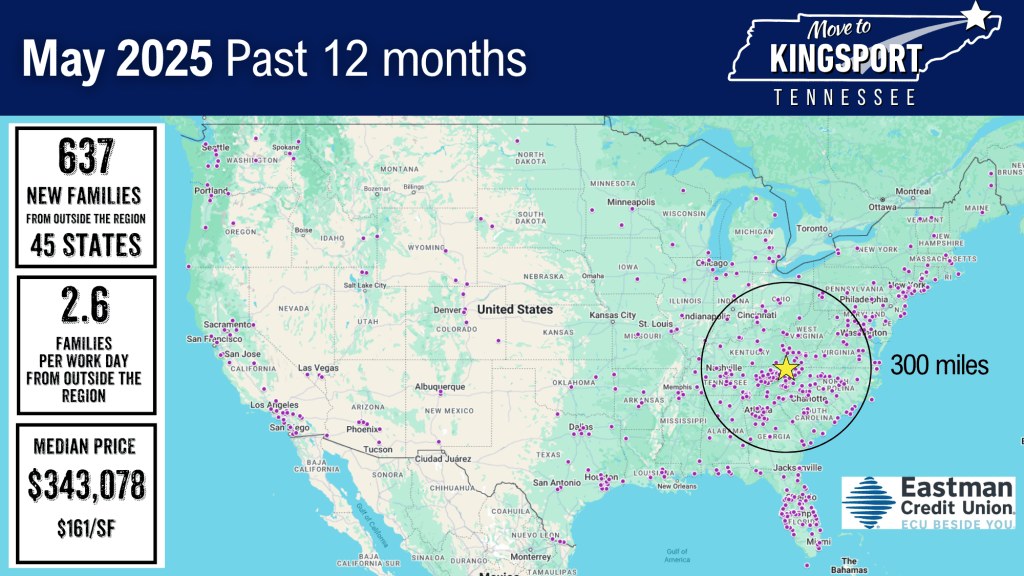
When we step back and look at the geographic reach over the entire twelve months (June 2024 through May 2025), dots marking origin locations span nearly the entire continental United States: from the Pacific Coast (San Francisco, Los Angeles, Seattle) through the Upper Midwest (Minneapolis, Chicago) and across to the Northeast (Boston, New York, Philadelphia). Yet roughly two‐thirds of those points lie within a 300‐mile radius of Kingsport, reflecting strong in‐region demand from nearby metros such as Knoxville, Nashville, Charlotte, and Atlanta. The remaining one‐third represent long‐distance moves—families coming from places as far‐flung as California, Washington state, and Massachusetts. Across that twelve‐month stretch, total home sales (those registered via water meters) reached approximately $128 million, underscoring sustained activity throughout the year.
Shifting to May 2025, the map still shows a national footprint but with a slightly tighter cluster of origins. Most May relocations—around three‐quarters—came from within that same 300‐mile circle (e.g., Tennessee, North Carolina, South Carolina, Virginia, Georgia). There were still a handful of long‐distance arrivals from Minnesota, Wyoming, and California, but the density of Southeast‐region points was even more pronounced than in the year‐long view. In other words, while Kingsport’s appeal remains nationwide, May’s moves skewed heavier toward neighboring states.
Housing prices over these two snapshots also paint a picture of stability with a hint of variation. Across twelve months, the median sale price was $343,078 at $161 per square foot. In May alone, the median slipped slightly to $341,500 but the price per square foot actually crept up to $168. This suggests that, in May, buyers may have been purchasing slightly smaller or newer homes at roughly the same dollar amount—hence a higher $⁄SF ratio—while overall affordability stayed consistent with the year‐long average.
Taken together, these two views illustrate Kingsport’s ongoing momentum. Over the past twelve months, a wide array of states contributed to growth, and those numbers stacked up to 2.6 families per workday. Yet May 2025 stood out: nearly one in every five of those annual relocations arrived in that one month, and at 3.7 families per workday, the market was busier than average. Regional migration remained the backbone—Southeast states accounted for the lion’s share of moves—but the sprinkling of long‐distance buyers underscores Kingsport’s broader appeal, from Chicago to San Francisco.
In short, Kingsport continues to blend stable, regionally driven demand with a steady trickle of newcomers from across the country. While the twelve‐month perspective highlights national reach and gradual momentum, May’s burst of activity reveals how seasonal rhythms can accelerate growth. Both maps—and their accompanying price figures—underscore a housing market that is vibrant, accessible, and balanced between local roots and far‐flung interest.

Leave a reply to Robert L. Arrington Cancel reply