MOVE TO KINGSPORT MONTHLY REPORT – MARCH 2026
The past month shows that Kingsport’s out-of-region draw remains impressively wide. March’s moves came from 25 states, which is a broad footprint for a single month.
The biggest monthly sources were Tennessee, Florida, and Texas, with additional moves from states such as New York and Virginia (outside the Tri-Cities, TN/VA region). California was unusually quiet last month. The data suggests Kingsport continues to pull most strongly from the South and broader Sunbelt.
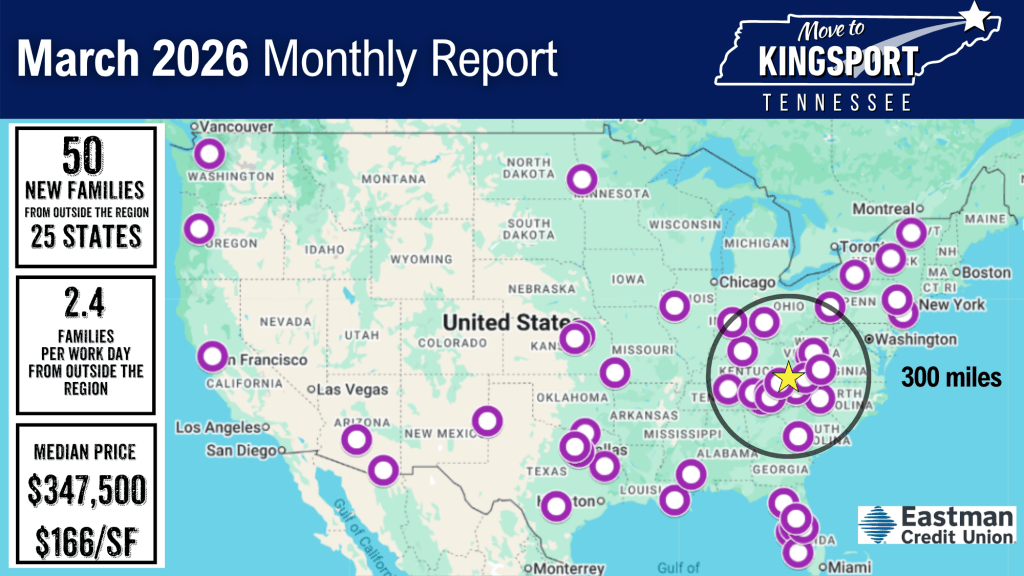
What makes that more meaningful is the kind of housing these households are choosing. The median out-of-region move in the past month landed in a home priced around $347,500, with about 2,092 square feet, 3 bedrooms, 2 baths, and a median year built of 1971. That is telling. These are not tiny units, nor are they primarily brand-new homes. They are practical single-family houses, often older, established homes with enough space for real households. That reinforces an important point: this is not speculative activity. Investor-owned rental properties, usually flip houses, are not included, and neither are apartment complexes, assisted living facilities, nursing homes, or similar settings. These are real people relocating to Kingsport, and where rentals are involved, they are renting single-family homes.
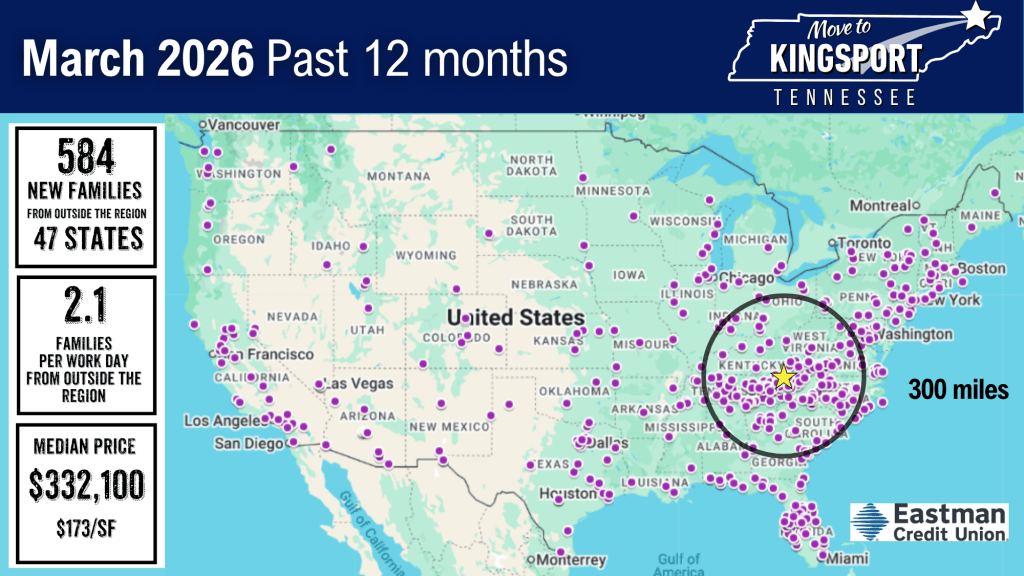
The past 12 months confirm rather than change the story. Over that period, Kingsport recorded 584 out-of-region moves from 47 states plus Washington, D.C. That means the city’s relocation footprint is still national in scope. But it is not random. The deepest and most consistent sources remain Tennessee, Florida, North Carolina, Virginia, and Texas. So while Kingsport’s reach is broad, its center of gravity still lies in the South and broader Sunbelt.
The housing characteristics tell a similarly consistent story. Over the past 12 months, the median out-of-region move involved a home priced around $332,100, with about 1,920 square feet, 3 bedrooms, 2 baths, and a median year built of 1975. In other words, the annual pattern looks a lot like the monthly one. Out-of-region households are not entering Kingsport primarily through the newest housing stock. More often, they are being absorbed through moderately sized single-family homes in established neighborhoods.
That may be one of the most important takeaways in the report. New construction since 2020 is part of the story, but it is clearly not the whole story. Kingsport’s existing housing stock is still doing a great deal of the work. In fact, compared with the broader since-2020 pattern, today’s out-of-region households appear to be paying more, but not necessarily buying newer homes. That suggests a market where the value proposition is still rooted in the city itself, not just in recently built product.
The renter-buyer mix is worth mentioning–consistently 55% buyers, 45% renters.
Kingsport continues to attract real out-of-region households from a broadening geographic footprint, and those households are finding their place largely through the city’s single-family housing stock, much of it older and already embedded in the community. The monthly data shows the latest expression of that pattern. The past 12 months show that it has real depth and staying power.

Leave a comment